The tale of three peaks: A Timeless Sequence for Timing Market Tops

If you've ever wondered how to spot a major market top before the panic sets in, history offers a powerful, repeating script. It’s not about predicting the exact day or the headline that will cause the crash; it's about observing the sequence in which key market pillars fall.
Recent charts of the British Pound/Japanese Yen (GBP/JPY), the Nasdaq 100 futures (NQ), and the US 10-Year Treasury yield (US10Y) tell a familiar story—one that echoes powerfully from the 2007-2008 financial crisis.
Let's break down the players in this drama:
The Canary in the Coal Mine: US 10-Year Yield (US10Y)
The 10-year Treasury yield is a pure gauge of market expectations for growth and inflation. When the economy is running hot and the future looks bright, yields rise. The "top" in yields signifies the moment the market starts to price in a slowdown. It’s the first warning sign that the fuel for risk-taking is running low.The Proxy for Global Risk: GBP/JPY
The GBP/JPY currency pair is a classic barometer for global risk appetite. The British Pound is considered a "risk" currency, while the Japanese Yen is a premier "safe-haven." When this pair is rising, it signals confidence and a willingness to seek yield. When it falls, it indicates a flight to safety. It typically peaks after yields, as the initial economic concerns begin to infect broader risk sentiment.The Last Bull Standing: Nasdaq 100 (NQ)
Representing the world's most innovative and growth-sensitive companies, the Nasdaq is often the final bastion of optimism. Momentum and narrative can keep it levitating even as the economic foundations crack. Its top is the final confirmation that the era of easy money and rampant speculation is over.
The 2007 Blueprint: A Perfect Storm in Three Acts
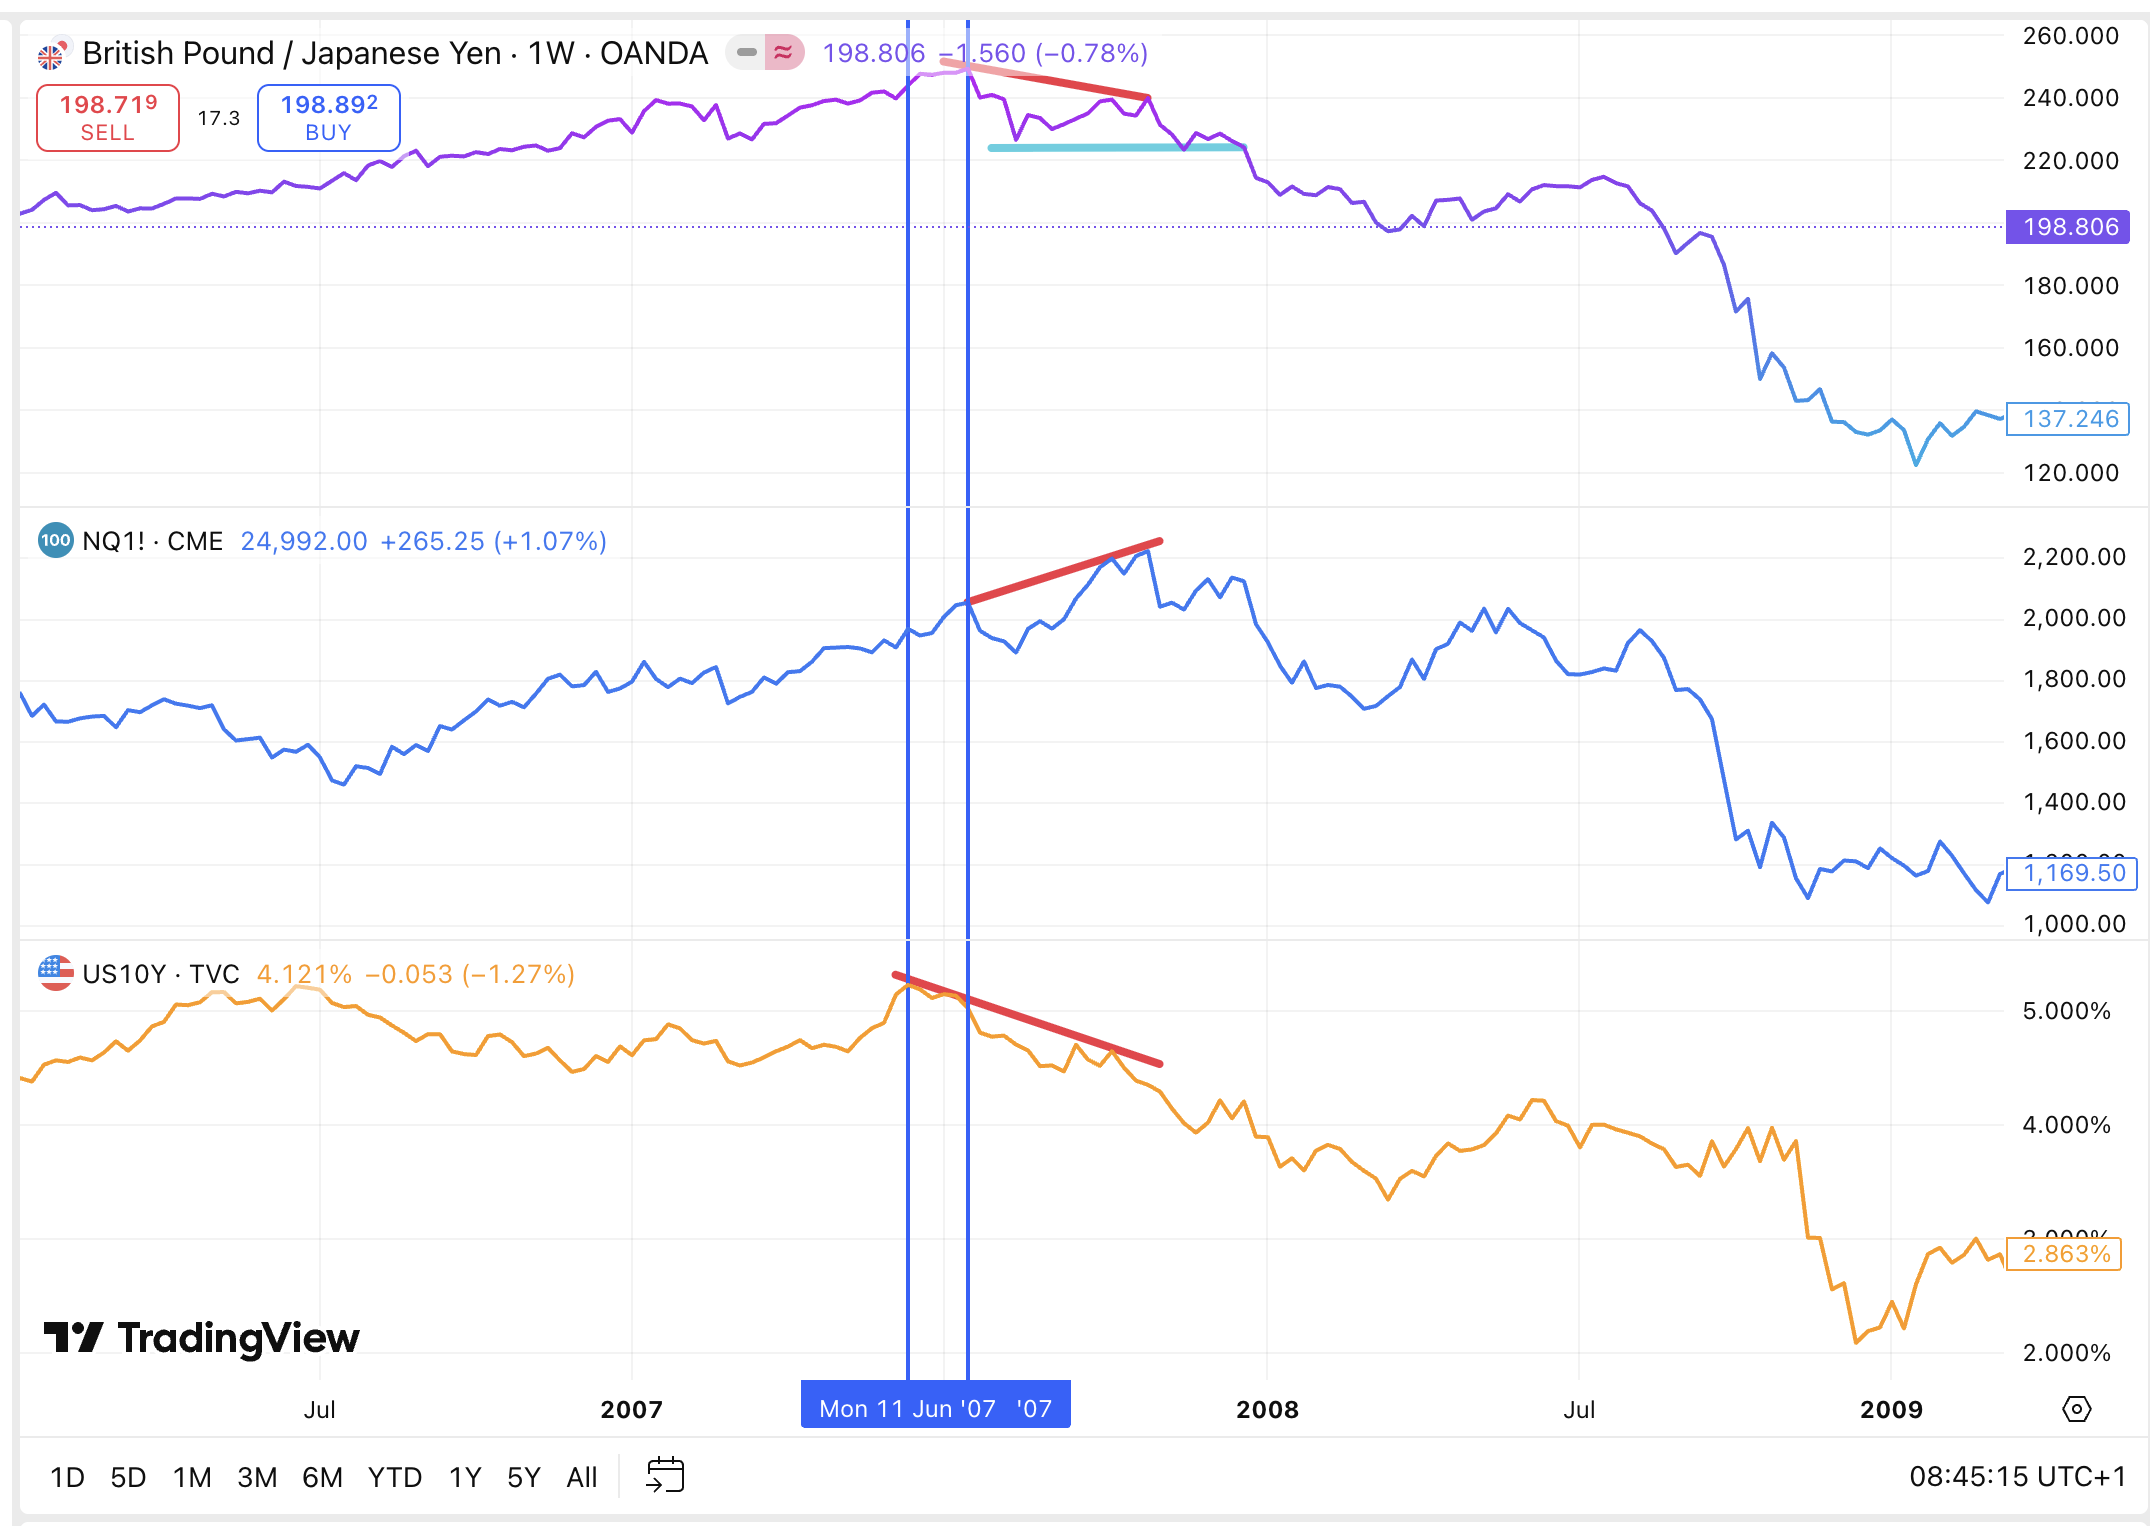
The second chart, dating from 2007-2009, is a textbook example of this sequence in action.
Act I: The Yield Tops (2007): The US10Y peaked in mid-2007. The market sensed something was wrong long before "Lehman Brothers" became a household name.
Act II: Risk-Off Begins (Mid-2008): The GBP/JPY pair, after a final push higher, began its precipitous collapse. This was the market loudly signaling a flight to safety as the subprime crisis intensified.
Act III: The Index Craters (Late 2008): The Nasdaq, having held on relatively well, finally capitulated, entering a devastating bear market.
The sequence was clear: Yields → GBP/JPY → Nasdaq.
The 2025 Setup: An Eerie Echo

Now, fast forward to the current data from the first chart. The same script appears to be playing out.
The Canary is Silent: The US 10-Year yield has clearly topped out and is trending lower, currently at 4.121% and falling. The market is pricing in a slowdown.
Risk is Waning: The GBP/JPY has also made a significant top. At 198.806, it is off its highs and showing weakness. The first two dominoes have fallen.
The Bull is Still Dancing: Yet, the Nasdaq futures (NQ) are still near their highs at 24,992.00, seemingly oblivious to the warning signs.
The current setup suggests we are in the late stages of the cycle. The key signal to watch now is the GBP/JPY. If it breaks to a lower low, it will be a powerful confirmation that global risk appetite is severely deteriorating. That is likely your cue that the Nasdaq's top is in.
Positioning for the Turn: How to Hedge
When this sequence completes, the downturn is often sharp and catalyzed by a credit event. Given the current environment, potential catalysts could lurk in over-leveraged Private Equity firms or the beleaguered Commercial Real Estate sector.
Once the GBP/JPY confirms the breakdown, it's time to aggressively increase hedges. Consider:
Index Shorts: Direct short positions on indices like the NQ or SPY.
Put Spreads: Buying put options (or put vertical spreads) on tech-heavy ETFs like QQQ to define risk and gain leveraged downside exposure.
Markets don't collapse at random. They unwind in a logical order, from the most economically sensitive instruments (yields) to broad risk proxies (GBP/JPY) and finally to the darlings of the bull market (Nasdaq). In 2025, we are two-thirds of the way through this classic sequence.
Until this happens, we think we should have full exposure to equities and gold. At Muffett investments, we are never fully invested in stocks. we use a multi- asset strategy. Our core is a basket of fundamentally good stocks which we have researched on and we use forex and index strategies to improve the returns. Our focus on the forex gives us an advantage not only because it is very uncorrelated to the stocks but also help us anticipate market tops.
Keep your eyes glued to the GBP/JPY chart. Its next major move down will likely be the starting pistol for the final, and most painful, leg of this market cycle. The canary is dead; the whale is turning; don't be the last bull left in the room.